
3 Scenarios and a Buyer Checklist for Singapore Property 2026
Private home prices should post modest, uneven growth through 2026 while HDB resale values stay flat to softer, with the Urban Redevelopment Authority recording a 0.5% quarterly rise for private homes against a 0.2% resale dip at the Housing & Development Board. Lower mortgage rates, a heavier completion pipeline and recent policy tweaks are pulling the market in different directions at once. Anyone transacting this year should stress-test their financing and check submarket supply before assuming the national figures apply to their target project.
TL;DR:
- Private home prices are expected to grow modestly, with regional variations: CCR outperforms at 2% in Q2, while RCR and OCR face softness.
- Developers face rising competition from a pipeline of about 55,800 private units, mostly completed by 2026, influencing negotiation leverage based on project timing.
- Mortgage rate resets and credit rules mean buyers should stress-test affordability at higher future rates, especially if rates remain elevated for extended periods.
- HDB resale prices continue to decline slightly, diverging from private market gains, which impacts the timing and sequencing of upgraders’ transactions.
- The market’s future depends on macro factors like interest rate movements, regional capital flows, and local supply-demand dynamics, making careful market assessment crucial.
Table of Contents
- Market outlook Singapore property 2026: the headline numbers
- How pipeline supply will shape prices and negotiation leverage
- What SORA and MAS rules mean for your real borrowing power
- Why HDB resale and private prices are moving apart
- Submarket outlook: where CCR, RCR, OCR and landed homes diverge
- Three scenarios for the rest of 2026
- A practical checklist before you buy or invest
- Macroeconomic forces shaping the 2026 outlook
- Demographic shifts feeding long-term housing demand
- Rental yields across the public and private markets
- Technology and sustainability reshaping how homes are valued
- Reading the signals without overreacting
- Where these figures come from
- Sources
- FAQ
Market outlook Singapore property 2026: the headline numbers
The overall private residential price index rose 0.5% quarter on quarter in Q2 2026, decelerating from 0.9% in Q1, according to the URA’s flash release. That deceleration matters more than the headline figure itself: it signals a market losing momentum even as it stays in positive territory.
Regional performance split sharply:
- Core Central Region (CCR): +2.0% in Q2, the clear outperformer.
- Rest of Central Region (RCR): -1.4%, the weakest segment.
- Outside Central Region (OCR): -0.2%, essentially flat.
- Landed homes: +2.6%, extending their run ahead of non-landed stock.
Statistic Callout: URA’s own flash-estimate methodology note warns that these figures are compiled from transactions submitted for stamp duty and developer sales up to mid-June, and can shift once final quarterly statistics are released. Treat flash numbers as a strong signal, not a locked-in outcome.
PropNex’s 2026 forecast, reported by The Straits Times, projects private prices rising 3 to 4% across the full year with roughly 9,000 new private home sales, a touch above URA’s implied run rate of 7,500 to 9,000 units. CBRE’s outlook expects a similarly stable pace of growth, with lower interest rates supporting buyer sentiment even as risks linger.
How pipeline supply will shape prices and negotiation leverage
Supply is the counterweight to every bullish forecast this year. URA estimates around 55,800 private residential units, including executive condominiums, are due for completion in the coming years, with a flash estimate closer to 61,000 units once newer projects are factored in.
- Roughly 4,745 private units sit on the 2H2026 Government Land Sales Confirmed List, adding fresh competition in specific districts.
- Unsold inventory with planning approval already granted gives developers less urgency to discount, but it also means nearby launches face direct competition from day one.
- Project-level completion timing, not the national pipeline figure, is what actually determines whether a seller feels pressure to negotiate.
A buyer eyeing a resale unit next to a half-empty new launch has real leverage. A buyer in a district with no confirmed-list land nearby has far less. Checking recent comparable transactions before making an offer remains one of the simplest ways to see which side of that divide you’re on.
What SORA and MAS rules mean for your real borrowing power
Advertised fixed mortgage rates have eased, but that headline number can mask reset risk further down the loan term. The Monetary Authority of Singapore publishes the Singapore Overnight Rate Average (SORA) daily, and the compounded SORA series is what most floating-rate packages actually reference once any promotional period ends.
MAS’s lending framework still governs how much you can actually borrow:
- The Mortgage Servicing Ratio (MSR) caps HDB and EC loan repayments at 30% of gross monthly income.
- The Total Debt Servicing Ratio (TDSR) caps all debt obligations, including the new mortgage, at 55% of gross monthly income.
- Banks apply a stress-test interest rate when assessing affordability, regardless of the rate you’re actually offered today.
Pro Tip: Run your own repayment model at a post-reset SORA level roughly 1.5 to 2 percentage points above today’s rate, then check whether you’d still clear TDSR comfortably. If the answer is no, treat the current low fixed rate as temporary relief, not a permanent budget.
Keep a CPF and cash buffer beyond the minimum required, since a rate reset combined with a job disruption is the scenario that catches most overstretched buyers off guard.
Why HDB resale and private prices are moving apart
Public and private housing are no longer tracking each other. HDB’s resale price index fell 0.2% in Q2 2026, extending a 0.3% decline in Q1, even as private prices posted gains. Resale transaction volumes also softened across H1.
Two policy shifts are reshaping how upgraders should sequence their next move:
- Removal of the 15-month wait-out rule for some HDB upgraders has changed how quickly certain households can re-enter the resale market after selling a private property.
- ABSD remission timing now demands closer attention, since missing the remission window on a replacement property purchase carries a meaningful cost.
- Sequencing matters more than speed. Confirm your CPF usage, secure any bridging loan in principle, and calculate your ABSD exposure before committing to sell or buy first.
Households treating HDB and private prices as one market risk mistiming both transactions.
Submarket outlook: where CCR, RCR, OCR and landed homes diverge
The national index hides more than it reveals this year. CCR’s 2.0% Q2 gain reflects renewed interest in prime districts, partly from buyers rotating out of a softer RCR. Landed housing’s 2.6% rise continues a pattern of limited supply meeting resilient demand from owner-occupiers rather than investors chasing rental yield.
- CCR: outperforming on scarcity and renewed high-net-worth demand.
- RCR: the -1.4% decline reflects heavier competing supply from recent launches in the same band.
- OCR: roughly flat at -0.2%, weighed down by unsold inventory near mass-market projects.
- Landed: structurally supply-constrained, insulating it from broader softness.
Tenure, project age and how much competing supply sits within a kilometre often swing local pricing more than the national trend. Analysis of integrated developments outperforming the broader market makes a similar point: mixed-use projects near transport nodes have held value better than standalone towers facing fresh competition.
Three scenarios for the rest of 2026
Forecast dispersion between PropNex’s 3 to 4% and other more cautious readings is itself a signal that this market has more than one plausible path.
- Conservative scenario. Rates stay higher for longer, GDP growth softens, and OCR absorption slows further. Private prices likely finish the year near flat to +1%, with RCR and OCR seeing continued softness while landed and CCR hold up.
- Base case. Rates ease gradually, supply absorption stays orderly, and PropNex’s 3 to 4% band proves roughly accurate. CCR and landed lead gains; RCR lags but stabilises by Q4.
- Optimistic scenario. Faster rate cuts and stronger regional capital inflows push private prices toward the upper end of forecasts, with RCR catching up as buyers rotate back in once pricing looks attractive relative to CCR.
Statistic Callout: Business Times analysis argues that H1 2026’s softer transaction volumes reflect fewer new launches and more selective buyers, not collapsing demand, an important distinction when judging which scenario is unfolding.
Watch six indicators through the rest of the year: OCR absorption rates, unsold inventory levels, SORA movements, MAS policy guidance, quarterly GDP prints, and how aggressively developers price new launches against resale comparables.
A practical checklist before you buy or invest
Before signing anything, model your numbers rather than relying on the headline forecast.
- Assume a mortgage rate reset roughly 1.5 to 2 points above today’s package, and check the repayment still clears MSR/TDSR.
- For rental purchases, model at least a 5 to 10% vacancy allowance rather than assuming full occupancy from day one.
- Ask developers directly about completion timelines and how many neighbouring units remain unsold.
- Ask sellers for the specific reason behind their asking price, whether it is a comparable sale, an agent’s estimate, or simple optimism.
- Ask your bank for the stress-tested affordability figure, not just the advertised promotional rate.
Pro Tip: A free, independent valuation before you negotiate gives you a number to anchor against, rather than reacting to whatever figure the seller or listing agent opens with. Register Today’s home valuation service is one practical way to get that baseline before you make an offer.
Negotiation leverage in 2026 sits with buyers who understand completion timing. A developer nearing a project’s completion deadline with unsold stock has far more incentive to move on price than one at the start of a sell-through cycle.
Macroeconomic forces shaping the 2026 outlook
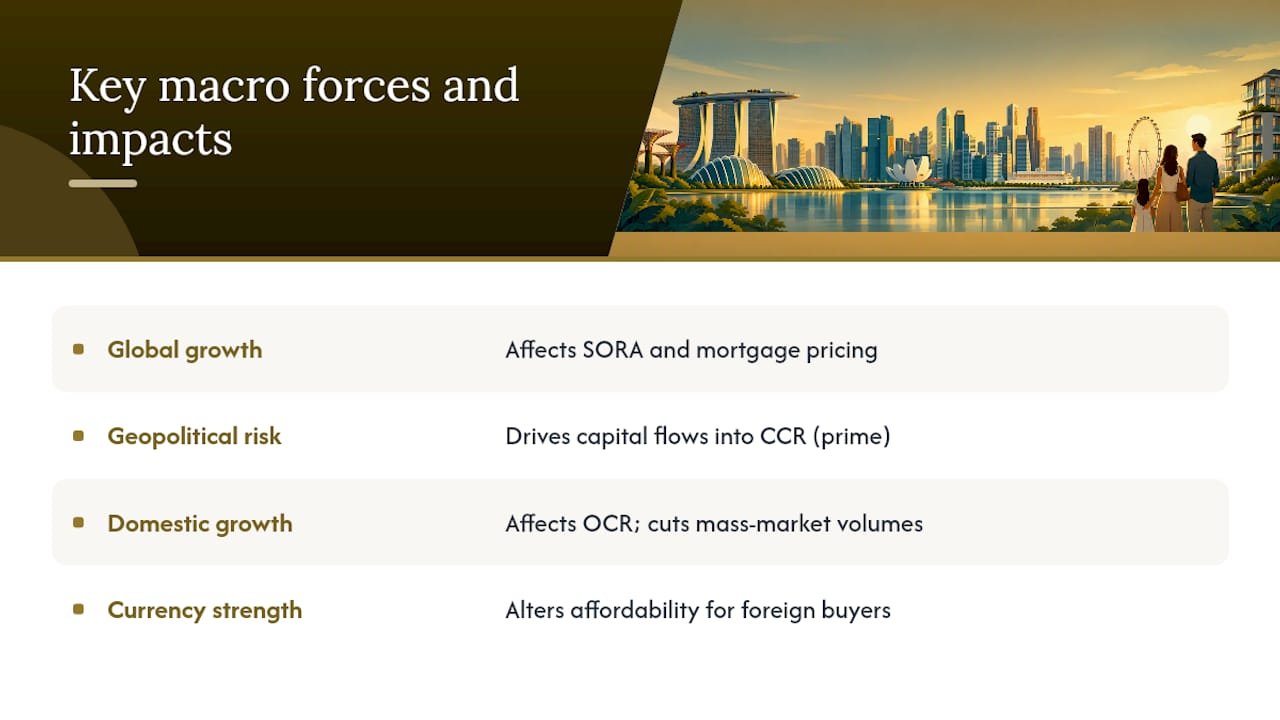
Singapore’s property market never moves in isolation from the global economy, and 2026 is no exception. Global growth remains uneven, with major economies managing sticky inflation alongside gradual interest rate normalisation, a combination that filters directly into SORA and, from there, into local mortgage pricing.
Geopolitical risk is the wildcard component. Trade tensions between major powers, shifting capital flows across Asia, and currency volatility in the region all influence how much foreign and regional capital lands in Singapore’s CCR segment specifically, since prime property has long served as a safe-haven asset for regional wealth. A pickup in that capital flow would reinforce CCR’s current outperformance; a pullback would remove one of its key supports.
Domestically, Singapore’s own growth trajectory matters more directly for the OCR and mass-market segments, where buyers are typically local households financing purchases from salary income rather than investment capital. Softer GDP prints tend to show up first in transaction volumes for these segments, well before they show up in headline price indices.
Currency strength also plays a quieter role. A firmer Singapore dollar can make local property comparatively more expensive for foreign buyers even when local price growth is modest, while a weaker dollar can attract fresh interest from regional investors seeking relative value. None of these factors move the market alone, but together they explain why quarterly price movements rarely follow rate changes in a straight line.
Demographic shifts feeding long-term housing demand
Population growth remains the structural floor under Singapore housing demand, even when quarterly price swings suggest otherwise. Household formation, immigration policy settings, and an ageing resident population all shape which unit types and locations see sustained demand versus which face a slower absorption path.
Smaller household sizes have pushed steady demand toward compact one and two-bedroom units, particularly in the OCR and RCR, where first-time buyers and young couples are more price-sensitive to absolute quantum than to price per square foot. This partly explains why smaller, well-located units in these regions have held resale value better than larger units competing against fresh launches offering more efficient layouts.
An ageing population is also reshaping demand at the other end of the market. More households are prioritising ground-floor or lift-accessible units, proximity to healthcare facilities, and estates with strong amenity provision, factors that increasingly separate resale winners from laggards within the same district.
Work-pass and permanent residency policy settings remain the single biggest swing factor on the demand side. Any material change to foreign workforce or PR intake feeds through to rental demand first and purchase demand second, typically with a lag of several quarters. Investors modelling five-year holding periods should treat population policy as a variable worth monitoring rather than assuming today’s settings hold indefinitely.
Rental yields across the public and private markets
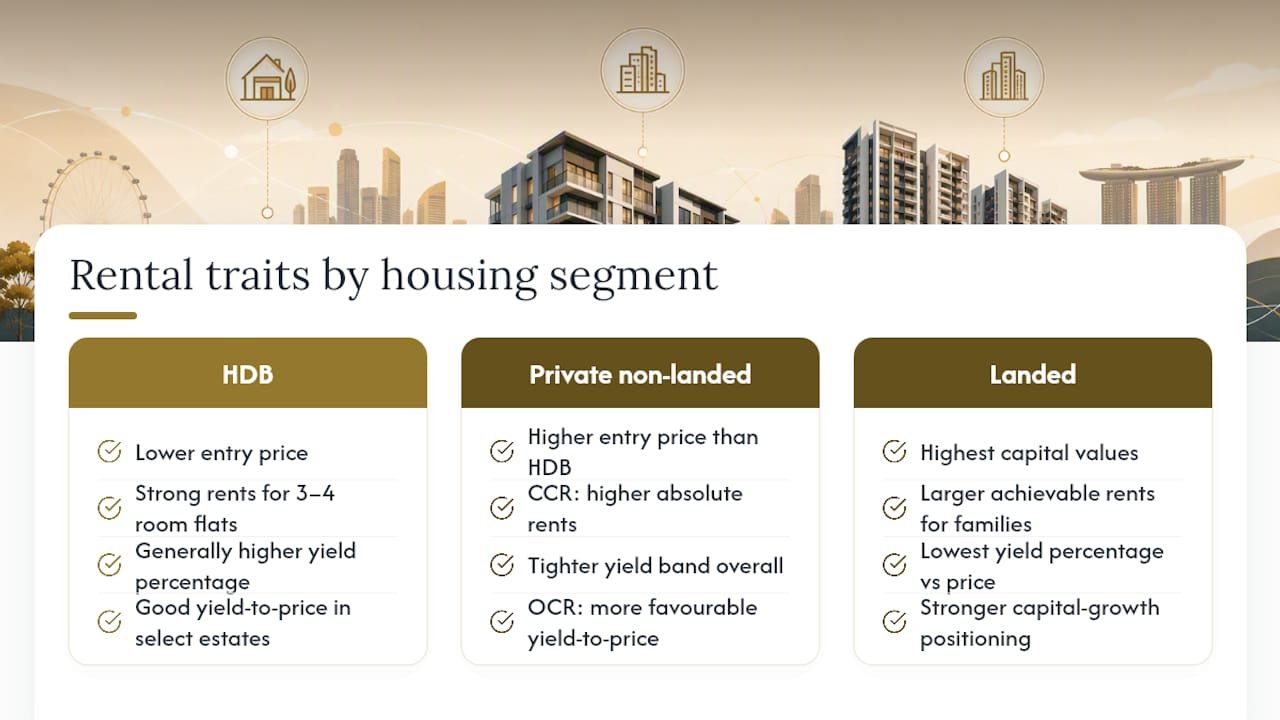
Rental demand has stayed firmer than the softer resale transaction volumes might suggest, particularly for well-located HDB flats and mass-market condominiums serving tenants priced out of, or unwilling to commit to, ownership amid rate uncertainty.
HDB rental yields have generally held up better in percentage terms than private condominiums, largely because entry prices are lower relative to achievable rents, especially for three and four-room flats in mature estates near MRT stations. Private non-landed yields tend to sit in a tighter band, with CCR properties typically commanding higher absolute rents but a lower yield percentage given elevated purchase prices, while OCR units often deliver a more favourable yield-to-price ratio.
Landed property rental yields generally lag both segments in percentage terms, reflecting high capital values relative to achievable rents, though landed demand from tenants seeking larger living space has stayed resilient among relocating families.
For investors weighing a purchase specifically for rental income, the practical takeaway is that yield and capital appreciation rarely peak in the same segment at the same time. A unit generating an attractive rental yield today, typically in the OCR or select HDB estates, may not be the segment best positioned for the strongest capital growth over the next few years, which sits more with CCR and landed housing based on current pricing trends.
Technology and sustainability reshaping how homes are valued
Sustainability credentials are starting to influence pricing at the margin, particularly for newer private developments carrying Green Mark certification or energy-efficient building systems. Buyers increasingly factor in projected utility costs alongside purchase price, especially as electricity tariffs remain a live household budgeting concern.
Proptech adoption has also changed how buyers and sellers gather information before transacting. Digital valuation tools, virtual viewings, and transaction-history platforms have shortened the research phase of a typical purchase, giving buyers faster access to comparable sales data than was available even a few years ago. That shift has quietly increased buyer negotiating confidence, since fewer purchases now happen without the buyer having checked recent comparable transactions first.
Smart-home features, once a premium add-on, are increasingly a baseline expectation in new launches rather than a differentiator, which means their absence in older resale stock is becoming a more noticeable discount factor than their presence in new stock is a premium. Developers have responded by building these features into base specifications rather than offering them as costly upgrades.
None of these trends are reshaping headline price direction on their own in 2026, but they are steadily changing what “comparable” means when valuing two otherwise similar units, one older and unrenovated, one new with efficient systems built in.
Reading the signals without overreacting
The honest synthesis of this data is that resilience and rising supply are coexisting, which creates selective opportunity rather than a uniform trend in either direction. CCR and landed housing are absorbing new supply comfortably; RCR and parts of OCR are not, and that gap will likely widen before it narrows.
The single biggest mistake I see buyers make is anchoring decisions to the national index or a single quarterly headline rather than checking submarket supply and comparable transactions for their specific target project. A 0.5% national gain tells you almost nothing about whether the specific development you’re eyeing faces three competing launches within 500 metres.
— Anderson
Where these figures come from
The URA’s flash and full releases remain the primary source for private price and pipeline data, while HDB’s quarterly updates cover resale performance. MAS governs SORA and lending rules, and CBRE plus Business Times provide market narrative and forecast context. Cross-check any figure against the original release before acting on it.
If you’re weighing a purchase, a sale, or a rental decision against these numbers, a starting point is a direct market check rather than relying on listing prices alone. Register Today offers a free property valuation that gives you an independent read on where your target property sits against current comparables, and the platform’s residential and commercial listings let you compare submarket options directly rather than guessing from national averages. For sellers timing a sale against the resale softness described above, listing through the platform puts your property in front of buyers actively working through the same 2026 data.
This article is general information, not a substitute for advice from a qualified financial advisor. Consult a qualified financial professional about your own circumstances before acting on anything here.
Sources
- URA media release (Q2 2026) — flash estimates and pipeline
- HDB: 2nd quarter 2026 public-housing data and upcoming flat supply
- MAS — SORA (Singapore Overnight Rate Average)
- CBRE — 2026 Singapore real estate market outlook
FAQ
Will mortgage rates go down in Singapore in 2026?
Fixed mortgage rates have already eased from recent highs, but floating-rate packages still track the compounded SORA benchmark published by MAS, which can move independently of advertised promotional rates. Borrowers should stress-test repayments at a higher post-reset rate rather than assuming today’s rate holds for the full loan term.
Are property prices expected to double in Singapore by 2030?
Current forecasts point to steady, single-digit annual growth for private homes rather than the kind of pace that would double prices within a few years. A rise from roughly 3 to 4% annually, as PropNex projects for 2026, compounds meaningfully over a decade but does not imply rapid doubling in the near term.
Is this a good time to buy property in Singapore?
It depends heavily on the submarket and your financing buffer, rather than the national headline. Softer transaction volumes in RCR and OCR, combined with rising pipeline supply, give buyers real negotiating leverage in those segments, while CCR and landed housing show less room to negotiate given their current outperformance.